Lecture5 Activity1: Linear Regression
Question 1: Simple Linear Regression
You can download the dataset HERE.
You are provided with a cats’ heart weight and body weight dataset,
and your task is to perform a simple linear regression using Prism
Graphpad. The dataset contains tho variables: Hwt
(dependent variable) and Bwt (independent variables).
Follow the steps below to conduct the analysis and interpret the
results:
Perform a simple linear regression using Prism Graphpad, with
Hwt as the dependent variable and Bwt as an
independent variable. Display the summary of the linear regression model
to obtain the estimated coefficient for Bwt. Interpret the
coefficient and \(R^2\) obtained from
the regression model.
Answer to Question 1:
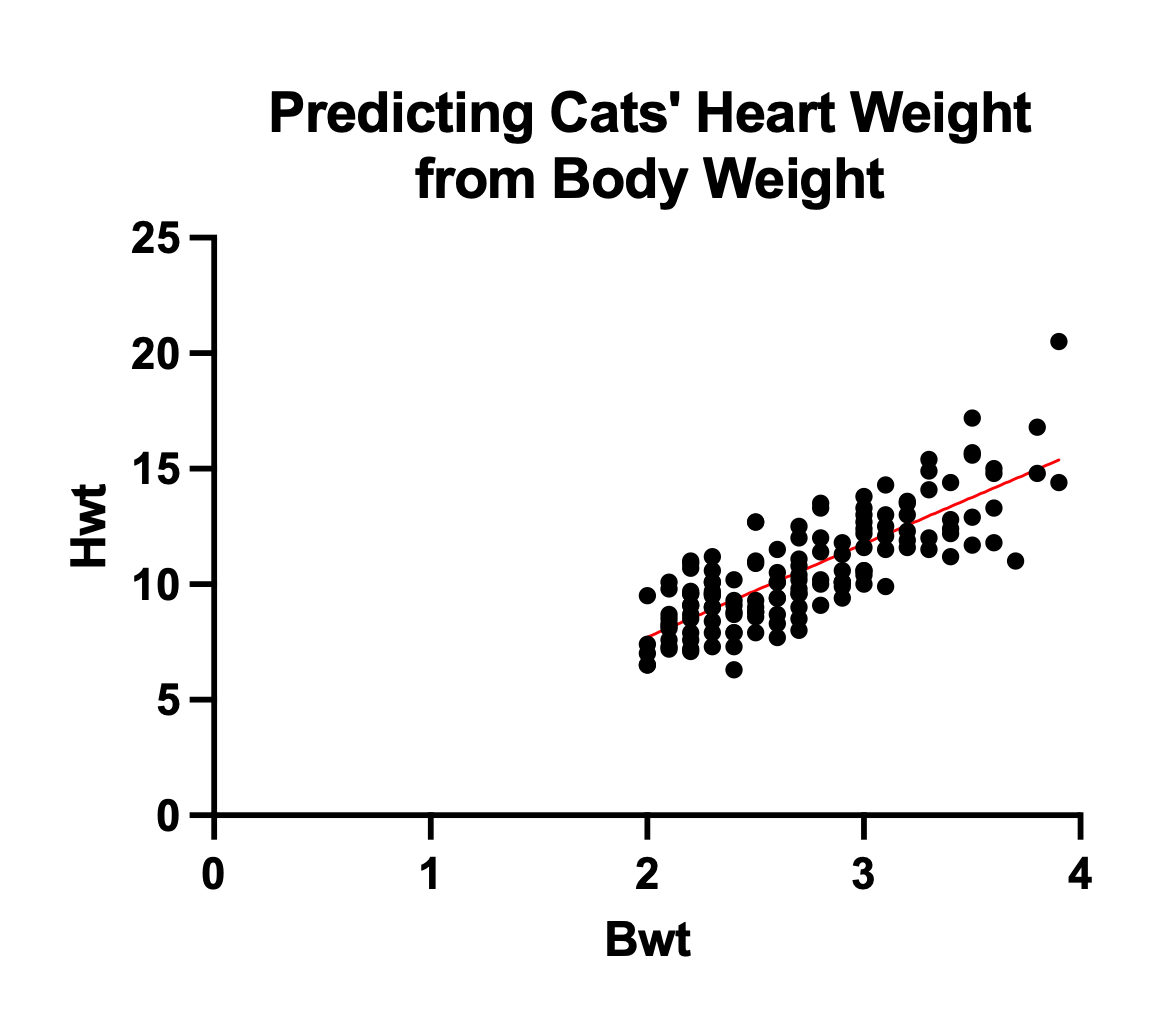
- Slope: 4.034
Indicates that, on average, cats’ heart weight increases by 4.034 units for every one-unit increase in their body weight. This positive slope suggests a positive linear relationship between cats’ body weight and heart weight.
- Y-intercept: -0.3567
Implies that when cats have a body weight of zero (which is not practically meaningful for this context), their estimated heart weight is -0.3567 units. The Y-intercept may not be directly interpretable in this case due to the unrealistic value of zero body weight.
- \(R^2\): 0.6466 Suggests that approximately 64.66% of the variation in cats’ heart weight can be explained by variations in their body weight. This R-squared value indicates a moderate level of correlation between the two variables.
The very low p-value (<0.0001) implies that cats’ body weight has a statistically significant impact on their heart weight. The significant slope confirms that there is a meaningful relationship between the two variables in the dataset.
Question 2: Multiple Linear Regression
After conducting a simple linear regression, we now seek to enhance
our analysis by introducing an additional independent variable,
Sex, and fitting a new multiple linear regression
model.
Using Prism Graphpad, perform a multiple linear regression model with Hwt (cats’ heart weight) as the outcome variable and Bwt (body weight) and Sex as independent variables. Obtain the summary of the linear regression model to extract the estimated coefficients for Bwt and Sex. Please interpret each coefficient, keeping in mind that Bwt is a continuous variable, while Sex is categorical.
You can download the dataset HERE.
Answer to Question 2:
Intercept (\(\beta_0\)): 1.060, with a standard error of 0.1020. It is significantly different from zero (t = 10.40, p < 0.0001), implying that when all other predictors are zero, the estimated
Bwtis 1.060. The Y-intercept may not be directly interpretable in this case due to the unrealistic value of zero body weight for female cats.Sex[M] (\(\beta_1\)): 0.2410, with a standard error of 0.05284. It is significantly different from zero (t = 4.561, p < 0.0001), indicating that, on average, cats with a
Sexvalue ofM(male cats) have a 0.2410 unit increase inBwtcompared to cats withSexvalue ofF(female cats).Hwt (\(\beta_2\)): 0.1412, with a standard error of 0.01021. It is significantly different from zero (t = 13.83, p < 0.0001), suggesting that for each one-unit increase in
Hwt, there is a 0.1412 unit increase inBwt.
In addition to the interpretation, we can also check the following information according to the Prism Graphpad analysis result:
The multiple linear regression model is statistically significant (p < 0.0001), as indicated by the F-test (F(2, 141) = 158.4), suggesting that the independent variables collectively have a significant impact on the dependent variable,
Bwt.The model’s goodness of fit is represented by R-squared, which is 0.6920, indicating that approximately 69.20% of the variation in
Bwtis explained by the independent variables (SexandHwt) in the model.The residuals’ normality tests (D’Agostino-Pearson omnibus, Anderson-Darling, Shapiro-Wilk, and Kolmogorov-Smirnov) indicate that the assumption of normality for the residuals is satisfied, suggesting the model’s residuals are normally distributed.
In the initial multiple linear regression model (
Hwt ~ Bwt + Sex), we assess the separate impacts ofBwt(body weight) andSex(categorical variable) on predicting cats’ heart weight (Hwt) without considering their interaction. The expanded model (Hwt ~ Bwt + Sex + Bwt:Sex) introduces the interaction termBwt:Sexto examine whether the relationship betweenBwtandHwtvaries between male and female cats, as there could be an association between body weight and gender. An ANOVA test will determine the significance of the interaction, helping us assess whether including it improves the model’s ability to predictHwtaccurately for cats.